 |
To make it easy to interact with your operational data, Amazon CloudWatch is introducing today natural language query generation for Logs and Metrics Insights. With this capability, powered by generative artificial intelligence (AI), you can describe in English the insights you are looking for, and a Logs or Metrics Insights query will be automatically generated.
This feature provides three main capabilities for CloudWatch Logs and Metrics Insights:
- Generate new queries from a description or a question to help you get started easily.
- Query explanation to help you learn the language including more advanced features.
- Refine existing queries using guided iterations.
Let’s see how these work in practice with a few examples. I’ll cover logs first and then metrics.
Generate CloudWatch Logs Insights queries with natural language
In the CloudWatch console, I select Log Insights in the Logs section. I then select the log group of an AWS Lambda function that I want to investigate.
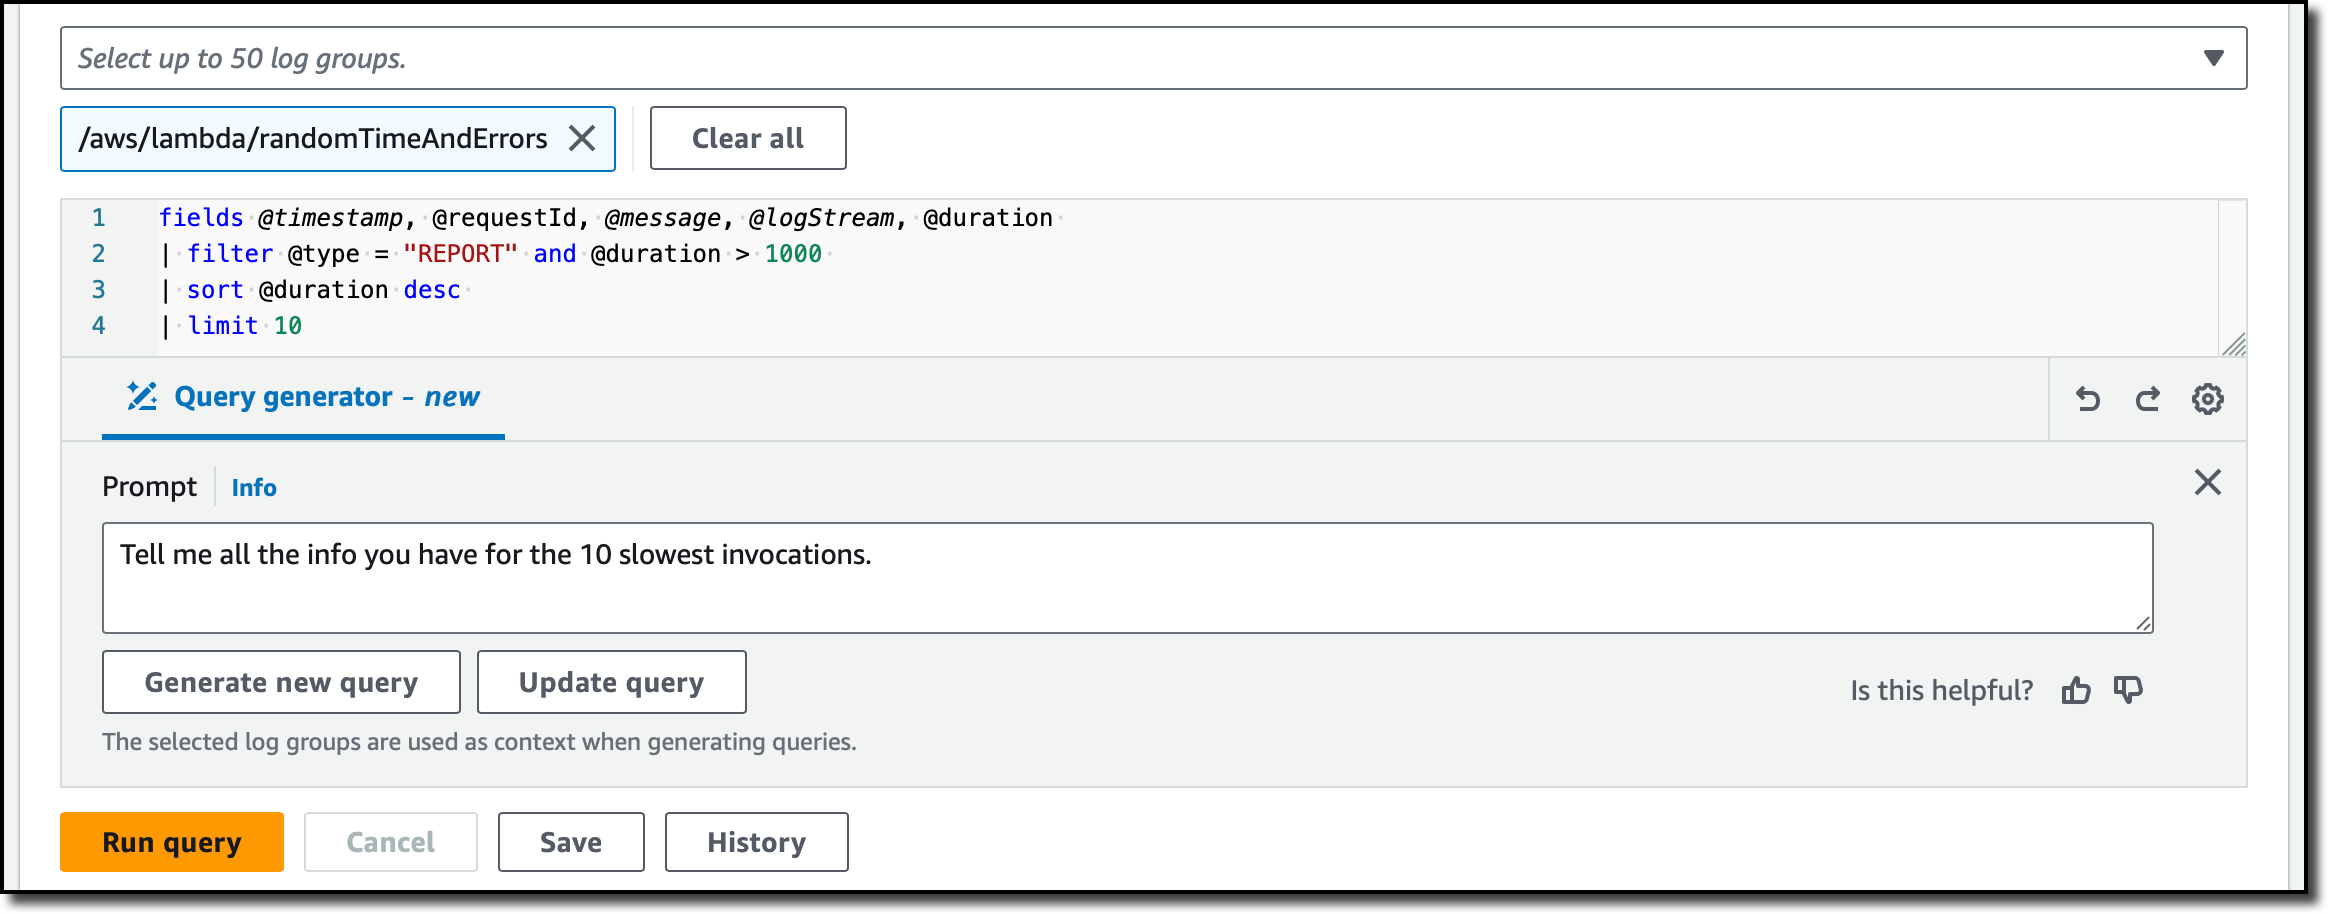
I choose the Query generator button to open a new Prompt field where I enter what I need using natural language:
Tell me the duration of the 10 slowest invocations
Then, I choose Generate new query. The following Log Insights query is automatically generated:

I choose Run query to see the results.

I find that now there’s too much information in the output. I prefer to see only the data I need, so I enter the following sentence in the Prompt and choose Update query.
Show only timestamps and latency
The query is updated based on my input and only the timestamp and duration are returned:
I run the updated query and get a result that is easier for me to read.

Now, I want to know if there are any errors in the log. I enter this sentence in the Prompt and generate a new query:
Count the number of ERROR messages
As requested, the generated query is counting the messages that contain the ERROR string:
I run the query and find out that there are more errors than I expected. I need more information.

I use this prompt to update the query and get a better distribution of the errors:
Show the errors per hour
The updated query uses the bin() function to group the result in one hour intervals.
Let’s see a more advanced query about memory usage. I select the log groups of a few Lambda functions and type:
Show invocations with the most over-provisioned memory grouped by log stream
Before generating the query, I choose the gear icon to toggle the options to include my prompt and an explanation as comment. Here’s the result (I split the explanation over multiple lines for readability):
Now, I have the information I need to understand these errors. On the other side, I also have EC2 workloads. How are those instances running? Let’s look at some metrics.
Generate CloudWatch Metrics Insights queries with natural language
In the CloudWatch console, I select All metrics in the Metrics section. Then, in the Query tab, I use the Editor. If you prefer, the Query generator is available also in the Builder.
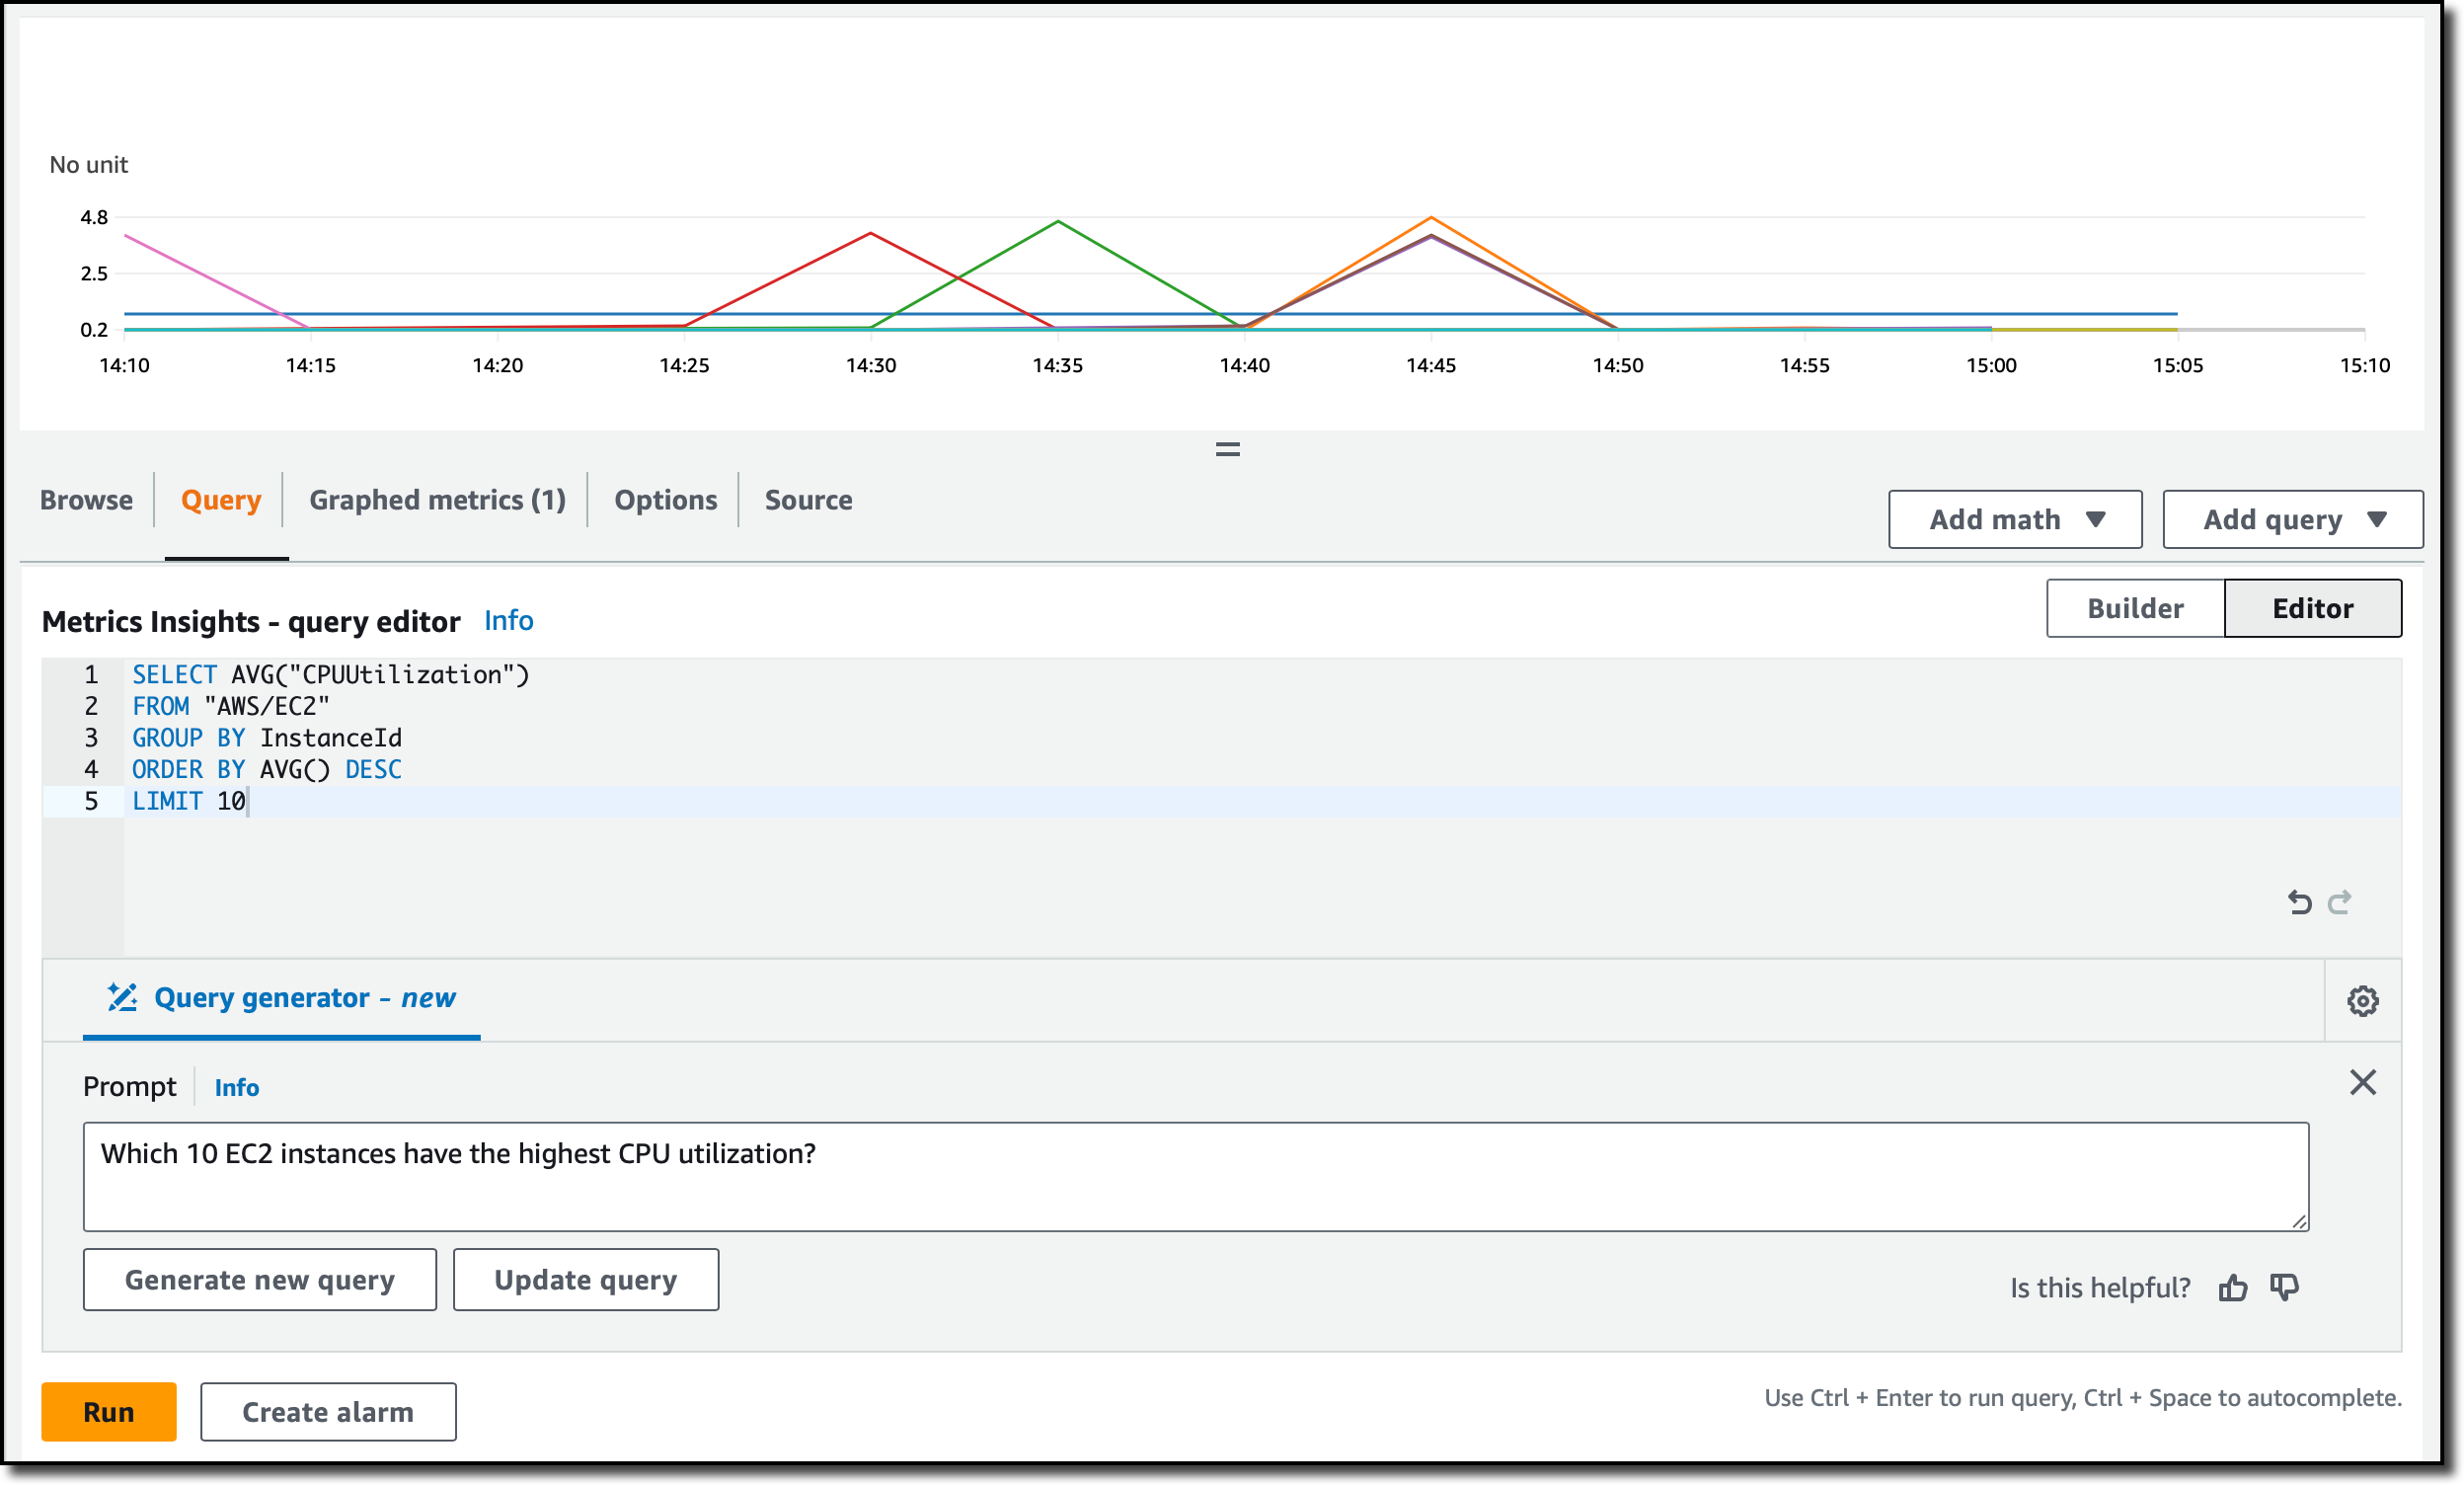
I choose Query generator like before. Then, I enter what I need using plain English:
Which 10 EC2 instances have the highest CPU utilization?
I choose Generate new query and get a result using the Metrics Insights syntax.
To see the graph, I choose Run.

Well, it looks like my EC2 instances are not doing much. This result shows how those instances are using the CPU, but what about storage? I enter this in the prompt and choose Update query:
How about the most EBS writes?
The updated query replaces the average CPU utilization with the sum of bytes written to all EBS volumes attached to the instance. It keeps the limit to only show the top 10 results.
I run the query and, by looking at the result, I have a better understanding of how storage is being used by my EC2 instances.
Try entering some requests and run the generated queries over your logs and metrics to see how this works with your data.
Things to know
Amazon CloudWatch natural language query generation for logs and metrics is available in preview in the US East (N. Virginia) and US West (Oregon) AWS Regions.
There is no additional cost for using natural language query generation during the preview. You only pay for the cost of running the queries according to CloudWatch pricing.
Generated queries are produced by generative AI and dependent on factors including the data selected and available in your account. For these reasons, your results may vary.
When generating a query, you can include your original request and an explanation of the query as comments. To do so, choose the gear icon in the bottom right corner of the query edit window and toggle those options.
This new capability can help you generate and update queries for logs and metrics, saving you time and effort. This approach allows engineering teams to scale their operations without worrying about specific data knowledge or query expertise.
Use natural language to analyze your logs and metrics with Amazon CloudWatch.
— Danilo


